Click to get a list of regulatory features (enhancers, TFBS, etc.) and gene disruptions (point mutations, indels, etc.) within or overlapping Dmel\l(3)69Ai using the Feature Mapper tool.
The testis specificity index was calculated from modENCODE tissue expression data by Vedelek et al., 2018 to indicate the degree of testis enrichment compared to other tissues. Scores range from -2.52 (underrepresented) to 5.2 (very high testis bias).
JBrowse - Visual display of RNA-Seq signals
View Dmel\l(3)69Ai in JBrowsePlease Note This section lists cDNAs and ESTs that fall within the genomic extent of the gene model, which may include cDNAs and ESTs of genes within introns, or of overlapping genes. Please see JBrowse for alignment of the cDNAs and ESTs to the gene model.
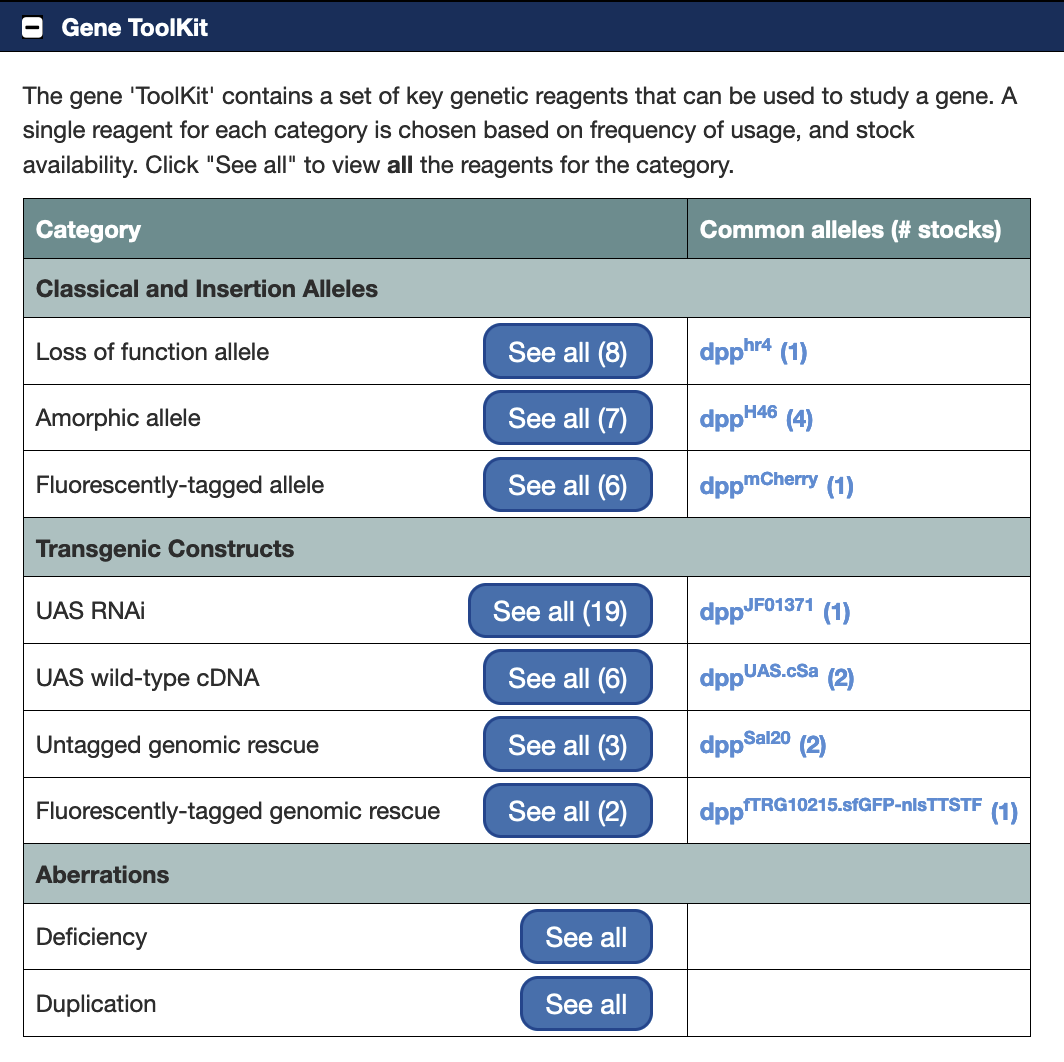
For each fully sequenced cDNA the DGRC maintains various forms of the cDNA (e.g tagged or untagged) in several different host vectors for subsequent cloning and expression in Drosophila and Drosophila cell lines.
Complementation groups l(3)68Fa, l(3)68Fb, l(3)68Fc, l(3)68Fd, l(3)68Fe, Nrx-IV, l(3)69Aa and l(3)69Ab isolated by Hoogwerf et al. (FBrf0048238) probably correspond to complementation groups l(3)68Fg, l(3)j2D3, l(3)68Fh, rols, l(3)68Fi, Nrx-IV, l(3)69Ah and l(3)69Ai isolated by Baumgartner at al, 1996, Cell 87: 1059--1068, but a one to one correspondence cannot be made as Hoogwerf mutations are apparently lost.
Complementation group isolated during complementation analysis of Nrx-IV region.